With five games played in the 2018/19 Championship, we thought we’d take a look at how the teams are shaping up in terms of attacking and defensive performance.
xG is a relatively new metric that calculates the expected goals scored for each team during a game. In simple terms, each shot on goal is given a rating from 0 to 1 – a scale of how likely that shot will result in a goal. The aim of xG is to determine performance because as we all know, sometimes the scoreline doesn’t accurately reflect a match.
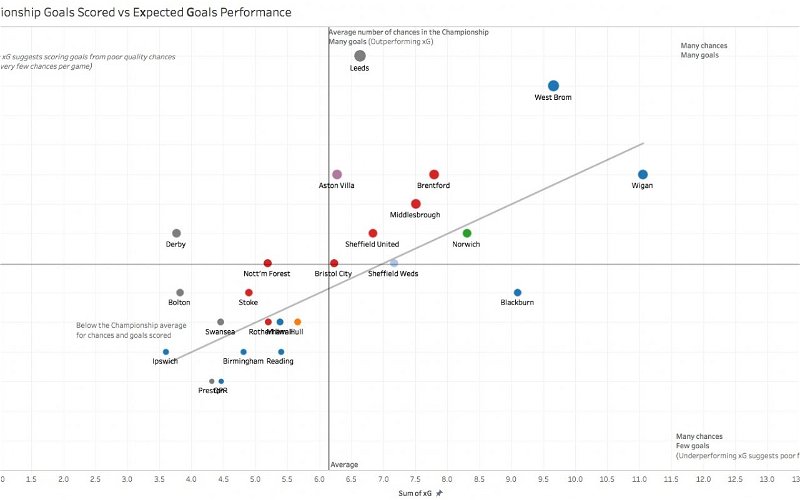
Goals Scored vs xG
The graph below shows a comparison of actual Goals Scored vs Expected Goals. It can indicate if teams are clinical (Goals Scored and xG are similar) or lacking finishing quality and not being clinical (xG is higher than goals scored).
Leeds for example have created chances that you’d expect to return between 6-7 goals but they’ve actually scored 14 which suggests that they’re scoring high quality goals and more goals than you’d expect them to given the chances they’re creating. For example, scoring screamers from 25-30 yards would help to score more goals than expected.
In the chart below, all of the teams that appear above the diagonal grey line are scoring more goals than expected. The others are scoring fewer goals which often suggests a lack of finishing quality and wasting too many chances.
Also, the two average lines – anyone above the horizontal line is scoring more goals than the league average. Anyone to the right of the vertical line are scoring higher than the team average xG.
So what does this tell us about the Swans?
- They’re scoring slightly above their xG.
- They’re below average in both goals scored and expected goals scored
- They need to start creating more and better quality chances.

Goals Conceded vs xG Against
Now lets look at the defensive performance. Again this aims to show the number and quality of chances each club are conceding and how this is reflected by the actual number of goals conceded. Above the diagonal line would indicate teams are unlucky – conceding more goals than expected. For example, Norwich City have conceded 11 goals compared to their conceded xG of around 5.7. In a nutshell, they’re conceding more goals than you’d expect given the chances they’re allowing. On the flip side of that, Middlesbrough have been lucky so far you could say, conceding just twice so far in 5 games.
Better news for the Swans, they conceding fewer goals and expected goals compared to the league average. However, their expected goals conceded is 6 compared to 4 actual goals conceded. This is mainly because they were very lucky not to lose by 2 or even 3 goals in the 0-0 draw away at Birmingham City. The Blues severely under-performed in terms of xG – suggesting poor finishing / not being clinical.
The likes of Hull and QPR have the worst defensive performance and you’d have to say both need to show a big improvement to avoid a relegation battle – but still – we’re only 5 games in to a long 56-game season.

xG data is by infogol.net