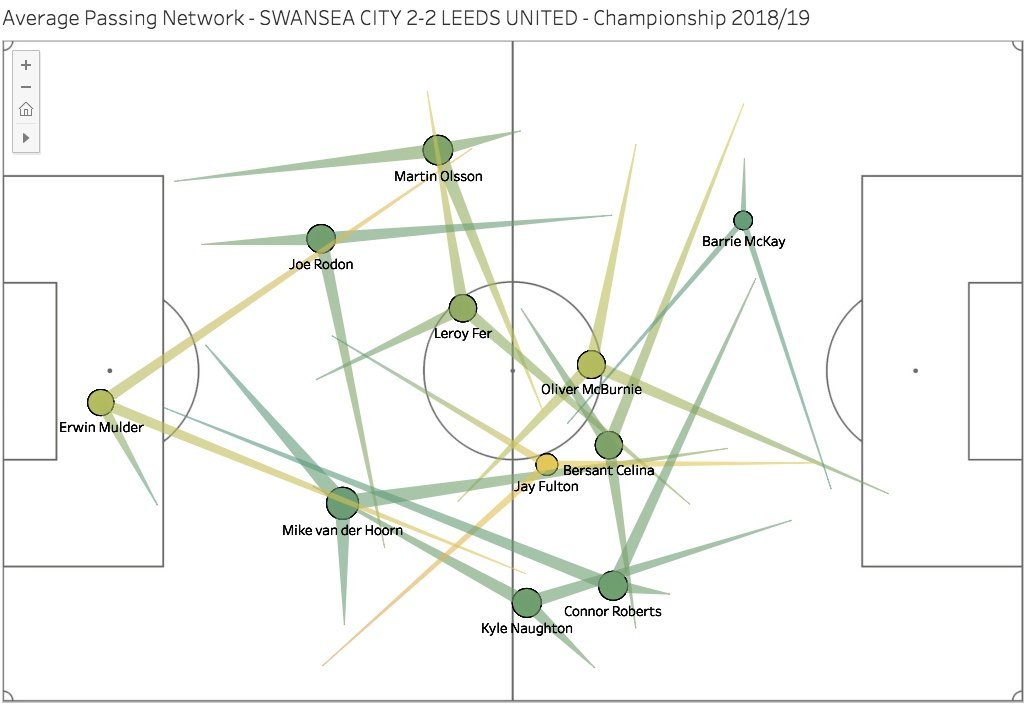
The passing network map for Swansea City against Leeds United in Tuesday’s 2-2 draw gives an insight into the balance of Graham Potter’s team in possession, how busy and accurate each player was in terms of their passing as well as their main passing directions.
Average Pass Map
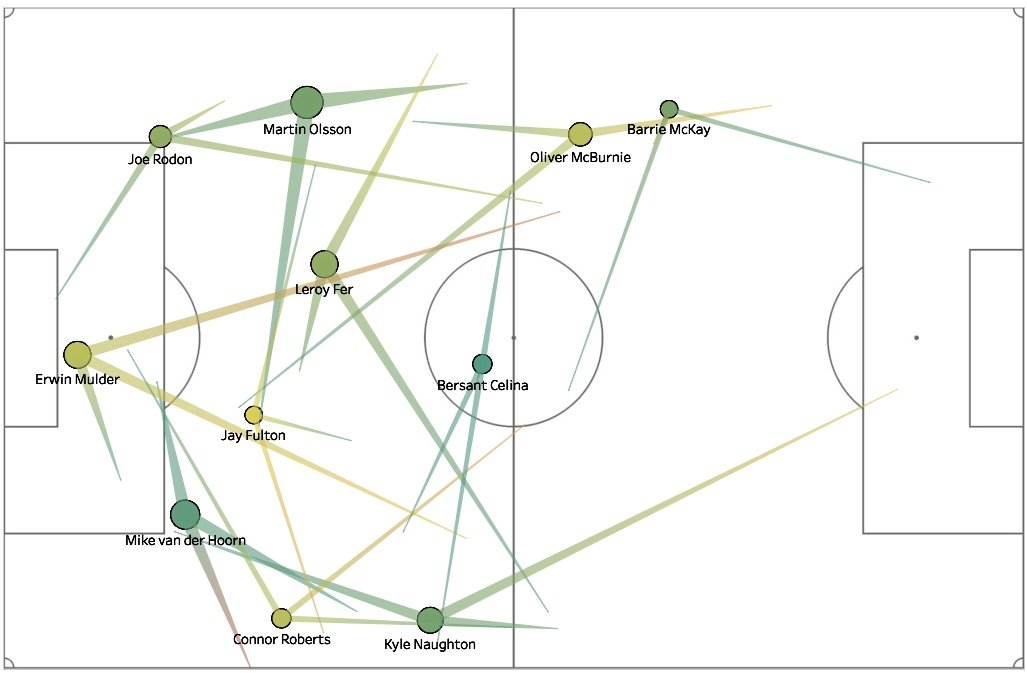
The average pass map is based on all passes made before the first substitution was made – so, in this case, it’s based on passing data in the first 63 minutes of the game.
Some of the main key points to gather from the pass map below are:
- The big distance between Olsson and McKay which shows a lack of link-up play between the two down the left flank
- This is opposite to the right flank, where both Naughton and Roberts are much closer together
- Goalkeeper Erwin Mulder mainly played the ball out to the fullbacks within his own half
- Oli McBurnie again dropped deeper into midfield to help link up the play
- Bersant Celina, in particular, was all over the pitch, making passes from and into various areas
- Compared to last season, the passing directions from the full backs were forward and much more positive, same goes for the centre-backs too.
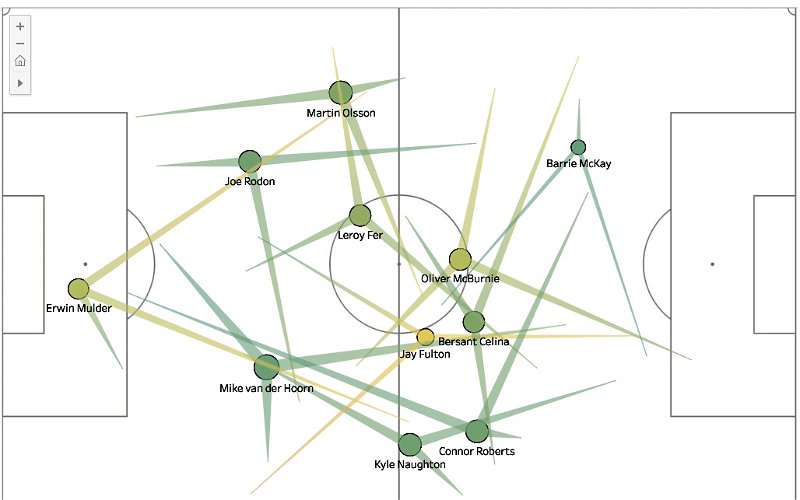
Low Phase Pass Map
The low phase pass map (below) shows each players’ average passes in their deeper positions. Without going into too much detail, a method called k-means clustering is used to determine the low and high groups of passes. This is a semi-manual process to ensure that each player’s average passing positions and pass locations reflect the actual data.
Some of the main observations here are:
- McBurnie shifts to the left, with most of his passes in a deeper position occurring on that side. It also shows his hold-up play, with many passes being played back to the full-back or into defence
- McKay’s position doesn’t alter much at all from the average pass map above
- Averaging a higher position in the average map above, Fulton drops deeper than Fer in the defensive phase
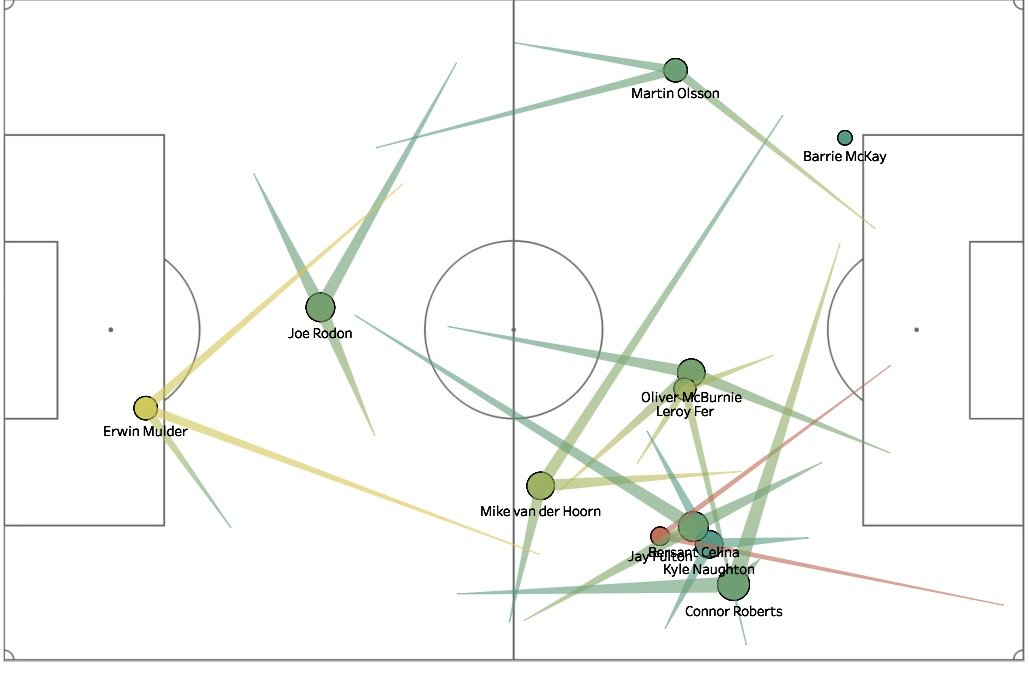
High, Attacking Phase Pass Map
The attacking phase pass map then shows how the passing shape changes in the opposition’s half of the pitch. The Swans are very over-balanced on the right with both Fulton and Celina moving to the right to join Kyle Naughton and Connor Roberts. Celina’s movement on the right is one of the focuses in our Part 2 match analysis article here.
With a lack of link-up play between Olsson and McKay, it’s no surprise to see two of his 3 most common passing directions being played backwards. McKay has no passing arrows because there was a lack of passes made in this area to locate them on the map.
Jay Fulton’s passing in the high phase was very poor as his attempts to play direct passes down the right channel very rarely came off.