Swansea City produced arguably their best passing performance away at Stoke City on Tuesday but had nothing to show for their efforts after Joe Allen’s offside goal early in the second half.
The Swans were impressive and much has been said since the game about how well manager Graham Potter has done to get this team playing such good, positive football. Some fans were left scratching their heads an hour before kick-off when the teams were announced, but they looked much the better side in the first half by playing neat and quick passing football out from the back.
Our stubbornness in playing out from the back got us into trouble at times and there’s still work to be done on being more effective at getting through the opposition’s high press but nevertheless, it was the quick passing and movement in Stoke’s half that we enjoyed watching.
https://twitter.com/CroJack2/status/1042792291264544769
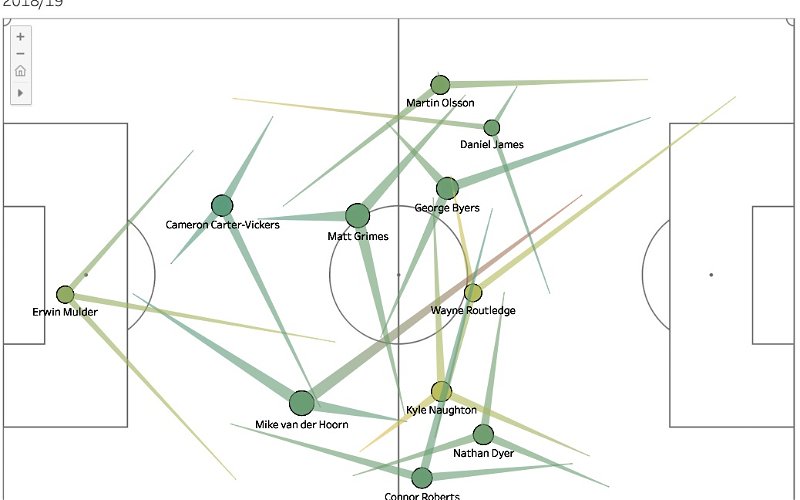
Like CroJack points out on Twitter, this was the first time that we’ve achieved plus-80% passing accuracy in a League game this season and our attacking tactics were slightly different in that we weren’t always looking for the long, direct ball to the wingers. Our play was more patient and building from the back which the average pass map below demonstrates.
I was not surprised with the line-up but I was positively surprised with Potter’s tactics. Stoke game was the first game this season that @SwansOfficial didn’t play counter-attacking football. Potter’s tactics was based on possession and creativity, rather than quick transitions.
— CroJack (@CroJack2) September 20, 2018
In previous pass maps, we’ve seen mostly long passing arrows from players which shows that the Swans were either forced into long passes or chose to play direct passes to the wingers.
Looking at the below map though for the first 63 minutes away at Stoke City on Tuesday, there’s far more shorter passes, particularly from the likes of Dan James, Byers, Grimes, Naughton and Dyer.
The Swans also played with two wide trios and Wayne Routledge through the middle. Olsson, James and Byers mostly combined together down the left with Grimes sitting behind them in support. On the right, Naughton pushed further forward compared to his opposite number Matt Grimes and joined Dyer and Roberts as the wide-right trio. Like Rodon has this season, his replacement Carter-Vickers sat in a deeper position compared to his centre-back partner van der Hoorn.

High Phase Pass Map
Looking at the high phase pass map provides an insight into how the players’ passing positions changed in a higher position, as well as the number of passes – showing the players involvement and the passing accuracy.
Like we’ve seen all season, the team split out wide and Routledge too moved across to the left. Nathan Dyer didn’t really get as far up the pitch as we’d have liked and it Naughton who averaged a higher position than the winger. It was almost like he swapped roles with Naughton at times when the ball was in these wide right areas inside Stoke’s half.

Low Phase Pass Map
Swansea were dominant on the right side in the low, defensive phase but as the previous pass maps have shown, Swansea’s build-up saw them move across to the left with the most of their better moves coming down Olsson’s left side of the pitch.
There are some longer passing arrows here but there are still some shorter average passes amongst the forward players like Byers, James and Routledge.

For our analysis on the overall team shapes including Stoke’s and a comparison, click here
It was yet another game that showed how versatile and unpredictable that Graham Potter can be with his line-ups and tactics. Even the Stoke manager admitted after the game that the Swans were difficult to work as they didn’t stick to rigid positions and had a lot of rotations.


