After comparing the new passing network maps for the games against Fulham (2011/12 season) and Southampton (2017/18), we were asked in the comments section to compare our first and last Premier League games away at Manchester City.
SpeakerJack said it would be an ‘interesting comparison’, and it just shows how much our passing game and ambition away at big teams has simply disappeared over the years.
Our first ever Premier League match saw us travel to Manchester City, a team that was rapidly developing into champions with players like Sergio Aguero, David Silva and Yaya Toure. That season they went on to win the first of three Premier League titles.
But despite being the Premier League new-boys, tipped for instant relegation that year after only winning promotion via the playoffs, then-manager Brendan Rodgers didn’t shift away from the principles that got his team to the top flight and told his side to play their usual passing game.
We managed 57% possession, 3 of our 6 shots were on target and attempted 580 passes with a success rate of 83.6%. Manchester City, in comparison, attempted 424 passes with 80.7% accuracy. Obviously, the 15 shots on target and 4 goals scored by the home side were the key stats, but this is only a focus on our passing game and our ability to mix it with the big teams away from home.
Passing Network Map – Quick Guide
- Circle/Line size – Total number of attempted passes
- Circle/Line colour – Pass success rate
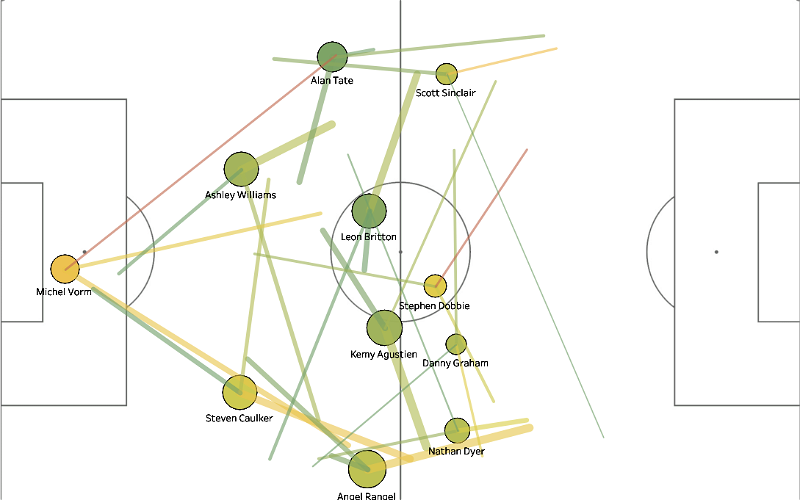
Average Pass-Map: Manchester City 4-0 Swansea City
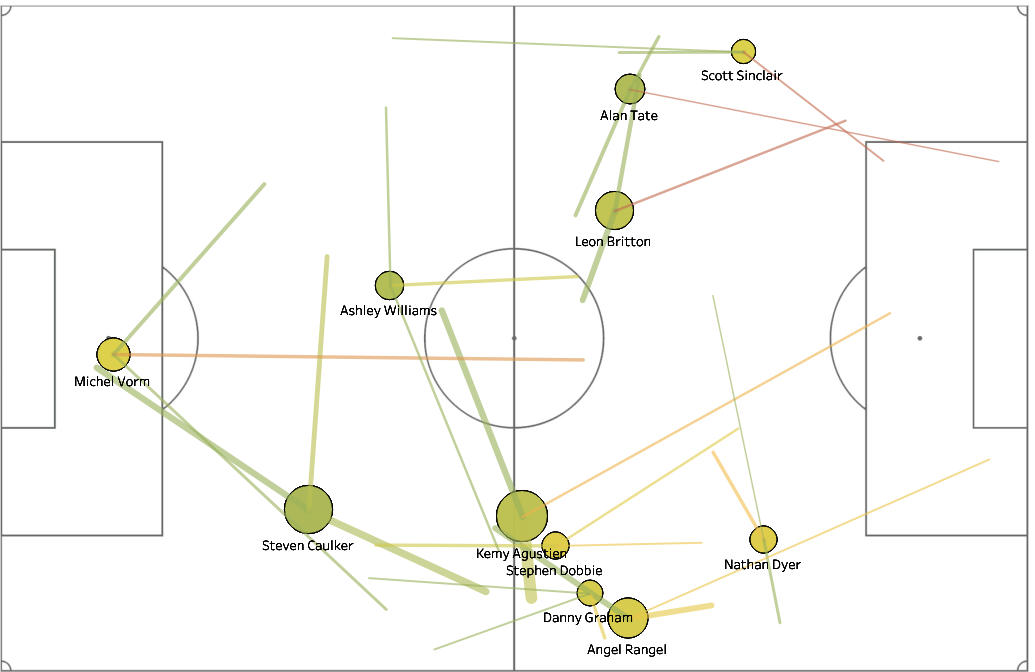
Let’s start with the good – our average passing map in our first ever Premier League match – away at eventual champions Manchester City.
The first thing to notice here is the size of the player circles and the green colours throughout – which shows a high number of attempted passes and a high success rate.
For each player, the top 3 average passes are shown. The lines point to the most common area of the pitch where they passed to during the game. The passing map only looks at passes made before the first substitution was made, so in this case, it’s 0-64 minutes.
The majority of the passes are relatively small, with a number of players making short passes to the nearest player. Goalkeeper Michel Vorm was able to pass out to the full-backs and Leon Britton rather than having to go long and direct.

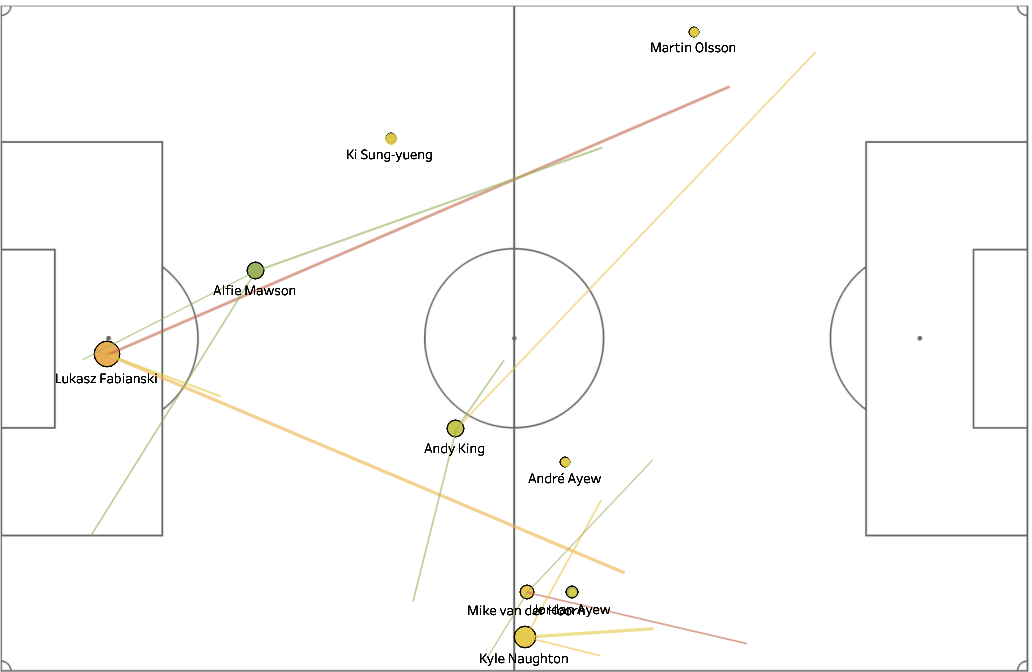
Average Pass-Map: Manchester City 5-0 Swansea City
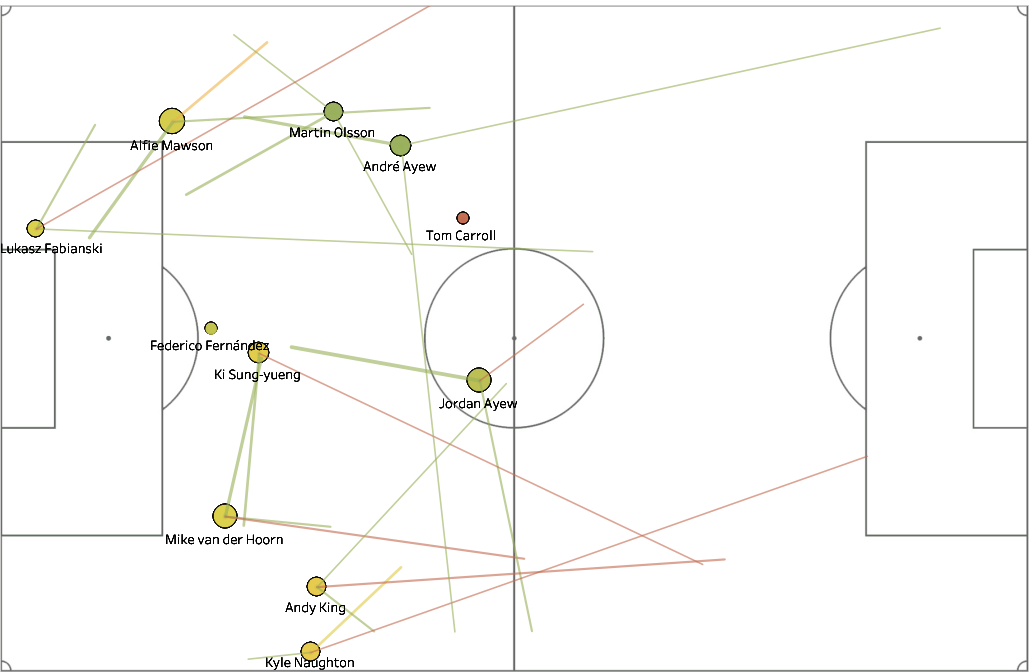
The average passing network map for the recent 5-0 defeat at Manchester City is the complete and utter opposite to the one above. Yes, it was a Pep Guardiola side who managed more than 1,000 passes during the game, but our attitude and lack of belief allowed them to do that. It’s worth noting that Huddersfield went to the Etihad Stadium and grounded out a 0-0 draw on their road to Premier League safety.
Below, the player circles are a lot smaller, the colours show a far worse pass success rate throughout and the passing lines are longer and more random. Fabianski had to make more long and direct passes with little success rate, and there is also no midfield. Andre Ayew drops deep alongside Ki, while Carroll and King shifted out to the right, leaving Martin Olsson lacking support on the opposite side.

Low Phase Passing Network
The low phase passing networks below show the average passing positions and passes in each player’s deepest position on the pitch – in the defensive or first phase of passing.
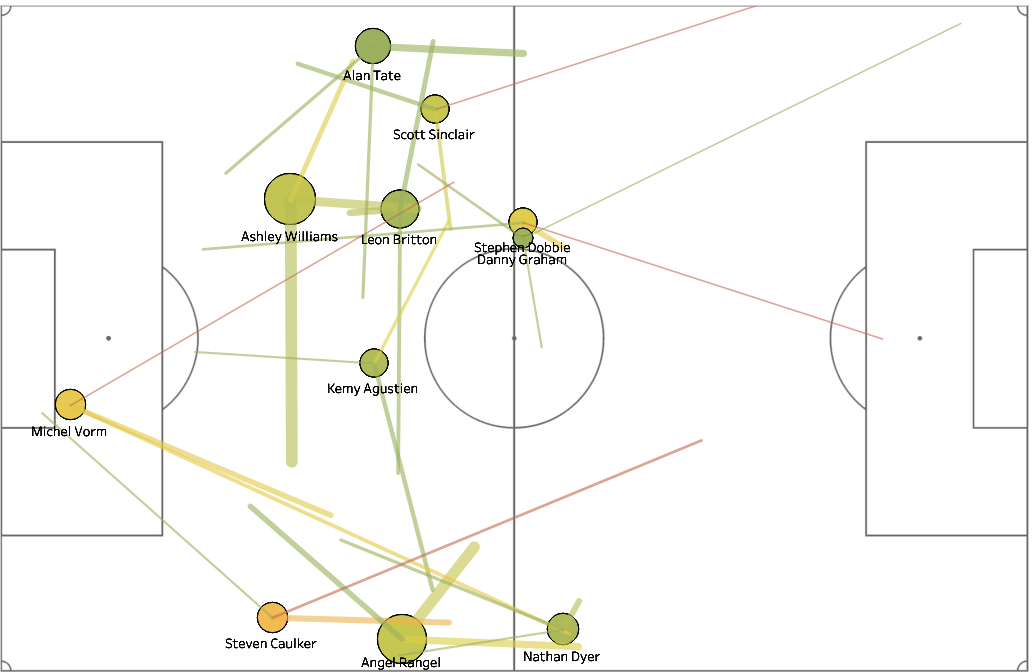
In both maps, you can see a lot of passes made in wide positions, but in the 2011/12 map, it’s clear to see that there was much better link-up play and cohesion in the defensive, wide passing positions. You can see a quartet of Williams, Britton, Sinclair and Tate on the left in 2011/12, and a less convincing trio of Caulker, Rangel and Dyer on the right.
You’ll notice in the 2017/18 passing map that some players don’t have passing lines. This is simply because of the fact that there weren’t enough passes to do a proper cluster analysis to determine the passing locations.
It’s also worth pointing out the central midfield comparisons between the two. Leon Britton and Kemy Agustien dominated in the middle, standing alongside each other in midfield, but in 2017/18 the midfielders are miles apart. Ki is positioned in front of Fernandez in 2017/18, with Carroll yards ahead near the half-way line with very few passes, poor success rate and no passing lines. The other midfielder, Andy King is in a wide right position supporting van der Hoorn and Kyle Naughton. There are absolutely no passing lines linking up the central midfielders whatsoever.
You could argue here that the overall comparison between the two games isn’t a fair one, but at the end of the day, the opposition are the same, and in 2011/12 we had never played a Premier League game before, yet we had 7 years of experience of top-flight football in the more recent trip to the Etihad. It just goes to show how our old philosophy and passing style is completely non-existent, plus our positive and ambitious tactics away at the top 4 sides.
2011/12 |
2017/18 |
 |
 |
High Phase Passing Network
The first thing worth mentioning here with the high phase passing network map is that the 2017/18 map is incomplete due to the lack of passes made in an attacking position, so some players won’t even appear.
The 2011/12 map is what you’d expect though, players splitting wide and there’s a good combination of passing lengths and a high average of pass success rate and total number of attempted passes.
Leon Britton averaged a passing position higher than that of Kemy Agustien as he linked up on the left with Alan Tate and Scott Sinclair. On the right flank, both Stephen Dobbie and Danny Graham shifted across, with passes aimed forward and direct towards the penalty area from the likes of Rangel, Agustien, Sinclair and Tate.
There was little point in attempting a high-phase passing map for the 2017/18 defeat. There was little activity down the right, none whatsoever down the left flank and the rest saw Fabianski and Andy King passing long and hopeful balls to the unsupported left-back Martin Olsson.
2011/12 |
2017/18 |
 |
 |
If you have any other requests, let us know in the comments!