It was another standard Swansea City passing performance on Saturday as McKay’s superb 15-minute strike was enough for three points at Bolton Wanderers.
Despite a more even second half where Potter’s side let their momentum slip after a strong opening 45 minutes, they still matched their season passing averages: 81.5% passing accuracy, 510 attempted passes and 415 completed passes per game. In comparison to those 17-match season averages, their numbers at Bolton were: 510 attempted passes, 418 completed passes and 81.96% passing accuracy.
In terms of individual players, James (88%), Rodon (92%) and Roberts (89%) were the top 3 best Swansea passers on the day. Three players there that have broken through our academy.
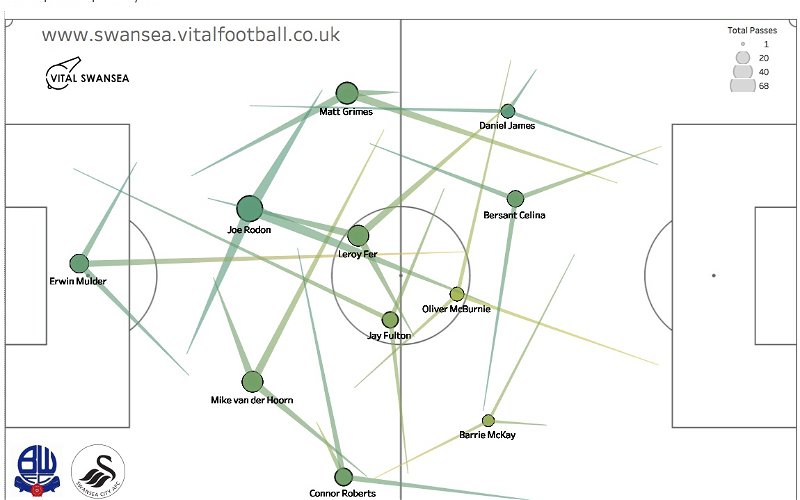
Average Pass Map
The pass map below shows the average passing positions for each player based on the first 61 minutes of the game prior to Potter’s first substitution. The darker the green the better passing accuracy and the size of the circles represent total number of attempted passes.
The pass map suggests that McBurnie was the acting number ten – averaging a deeper position compared to Celina who pushed further forward linking up with Dan James on the left.

Defensive / Low Phase Pass Map
The defensive, low phase pass map shows the activity in deep positions. Using a technique called clustering, a ‘deep’ cluster of passes is used to determine the players’ average positions and their three most common passes.
It’s interesting here to see so much activity on the left side with very little on the right and it’s the same for the high, attacking phase pass map too.

Attacking / High Phase Pass Map
The attacking pass map below shows how the passing activity in the attacking phase was focused and concentrated on the left flank with Dan James unsurprisingly being the main outlet. McBurnie shifted across to that area to join the likes of Celina and James.
McKay is missing completely as he lacked enough data or passes to plot his averages in the high phase.

McBurnie and Celina’s Positional Changes
The pass map below shows Celina and McBurnie’s positions – the defensive, overall average and high phases and shows how their positions change as the ball moves further up the pitch.
Both players play a changing role through the different phases of play. McBurnie’s deep passing activity is in a low, wide right position but he moves and shifts across to the left in and around the final third. For Celina, he’s involved centrally in the middle third but he too gets more involved on the left flank as the team look to get Dan James on the ball as much as possible.