Here on Vital Swansea we try to cover a wide range of different articles, from fan opinionated pieces to match reports, stats and analysis. As football evolves and more and more data becomes available, we’re seeing more data and numbers used to analyse performance.
All this stats and data flying around seems to be a bit like marmite amongst fans from what I’ve seen so far – they either love it or hate it.
I must admit I do like looking at some of the data that Opta produces and how it’s used to create analysis and charts. After all, the clubs themselves are using it to assess performance and improve so there must be some value in it, although it has its limitations – to say the least.
An example of a limitation to stats could be passing accuracy whereby the receiver of a pass could be the fault of an unsuccessful pass, rather than the actual passer itself. And in this particular analysis, where we look at pressing intensity, it does have its limitations and we’ll explain later what these potentially could be.
PPDA – What is it?
In a nutshell, PPDA (Passes Per Defensive Action) is a measure of pressing intensity. The high press has quickly grown in popularity in recent years with the likes of Pep Guardiola, Mauricio Pochettino, Marcelo Bielsa and Jurgen Klopp being highly in favour of it – but how can you actually measure it and give it a number?
With comparisons and analysis now a huge part of the modern game, there has to be a measure to “score” the high press.
As opta explains here, PPDA is calculated as follows:
“Opponent passes allowed per defensive action, in the opponent’s defensive 3/5ths of the pitch.”
Defensive actions are as follows:
- Tackles
- Interceptions
- Challenges (failed tackles)
- Fouls
The lower the PPDA score, the better and more intense the press.
In terms of a benchmark, from what we can gather in terms of best performing averages across Europe, a good PPDA score is around 7-8.
In simple terms, a PPDA score of 8 for example, says that the team allowed 8 passes per defensive action in their final 3/5ths of the pitch.
The Detail
Rather than simply telling you the numbers, we thought we’d map them out graphically so you can see the comparison between Swansea City’s pressing approach and Preston’s, and we saw a big contrast between the two.
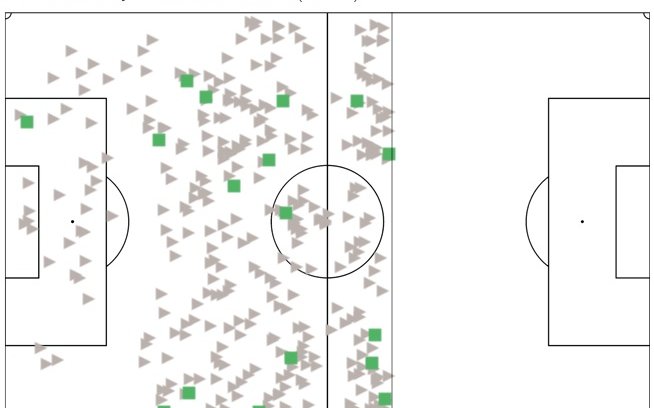
Swansea City
The pitch map below shows:
- Preston’s passes (grey triangles)
- Swansea’s defensive actions (green squares)
You’ll also notice that this metric only looks at data in the final 3/5ths of the pitch. This is all of the opposition’s half and a small part of the team’s own half. You can read more information on this in an excellent article here
Passes Allowed (324) / Defensive Actions (18)
PPDA = 18.00
The PPDA score of 18 is poor in terms of pressing intensity and suggests that the Swans were happy to sit back in their own half.
You’ll also notice below that the Swans pressed in wide areas which is hardly surprising given that Graham Potter’s tactical approach so far has been keeping his wingers high up the pitch, with Oli McBurnie involved in high pressing through the middle but also dropping deep into midfield.

Preston North End
In the map below, now we can see:
- Swansea City’s passes (grey triangles)
- Preston’s defensive actions (green squares)
Preston too pressed higher in wide areas and they made far more defensive actions higher up the pitch compared to the Swans, more than double in fact with 43 compared to Swansea’s 18.
Passes Allowed (312) / Defensive Actions (43)
PPDA = 7.26

Figures Breakdown
The main comparisons in the figures breakdown below is the difference in interceptions – with Swansea making just 1 vs Preston’s 16.
Pass Success Rate: Swansea – 73.7% vs Preston – 83.3%

Side by Side Comparison
Swansea’s PPDA might have been very high at 18 but the bottom line in all this is that we won the game 1-0 and kept a clean sheet in the process.
And that’s the thing with stats and football. Better and more impressive stats doesn’t necessarily transfer across in wins and points gained.
We also mentioned earlier about the limitations with these stats and measures. Passing accuracy for individual players can be reduced as a cause by an error by the receiver, and in terms of PPDA, the high press could be more effective than the score suggests. For example, the one statistic that isn’t included in this calculation is the number of passes that are forced to be played out of play. We sometimes see goalkeepers and defenders having to pass into touch as a result of a high press.
As a final note, the PPDA scores for our opening day win at Sheffield United were: