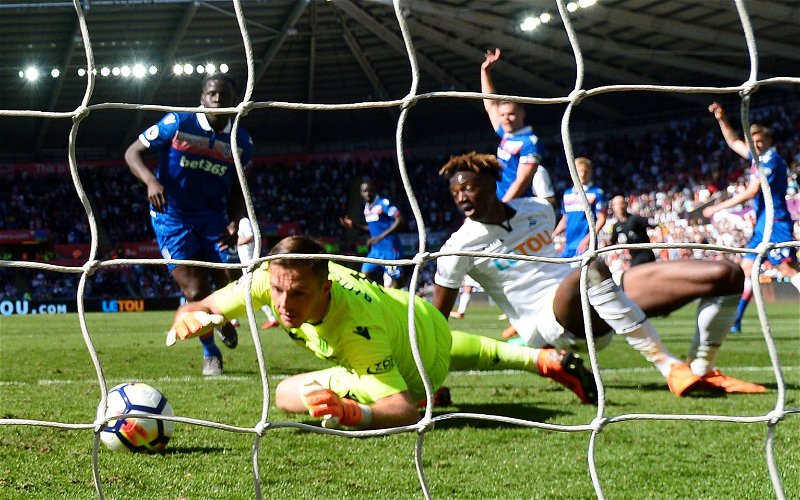
You might have heard of xG – or eXpected Goals, a new metric that’s grown in popularity in recent seasons, so much so that the likes of Match of the Day and Sky Sports are including it in their live coverage.
In a nutshell, ‘expected goals’ is designed to calculate the number of goals a team is expected to score based on the quality and quantity of the chances created.
More and more coaches and managers are now using data and analytics to assess their team’s performance as well as the opposition.
Using a number of different variables including distance from goal, the angle of the shot and pressure on the shot taker to name just a few, each shot taken is given an xG value – between 0 and 1, which is then totalled up to give an overall xG value. For example, a shot with an xG value of 0.5 would be expected to be scored 50% of the time.
xG provides a number of interesting assessments of a player and team. A team scoring fewer goals than their xG value would indicate that they are not finishing chances that they should be scoring, while over-performing xG would show that teams and players are scoring more goals from poor quality chances. This could indicate players and teams as superb and clinical finishers, but other examples of this could be wonder-strikes from 30 yards or in-direct free-kicks that are scored.
xG also helps to indicate how a match was played out. On many occasions we see teams winning games that they didn’t deserve to. Our 1-0 home win against Liverpool is always the first one that comes to mind. The Reds missed a number of clear chances that you’d expect them to score, while we just happened to score our one decent chance while hanging on by a thread. Incidentally, the xG for that game was 2.2 – 0.5 in Liverpool’s favour. Fernandez’s goal was given an xG rating of 0.41, while Liverpool missed chances valued at 0.68 and 0.48 respectively. But that’s football.
Swansea’s xG Score in 2017/18
Unsurprisingly, we scored fewer goals than expected based on the quality of our chances, but only just. Our xG score of 29.71 is just higher than the 28 goals we scored.
That 29.71 value is the lowest in the Premier League:
| Pos | Team | F | A | Pts | xG | xPTS |
| 15 | Brighton | 34 | 54 | 40 | 37.21+3.21 | 40.85+0.85 |
| 13 | West Ham | 48 | 68 | 42 | 36.80-11.20 | 39.26-2.74 |
| 19 | Stoke | 35 | 68 | 33 | 36.75+1.75 | 36.17+3.17 |
| 20 | West Bromwich Albion | 31 | 56 | 31 | 35.18+4.18 | 42.96+11.96 |
| 7 | Burnley | 36 | 39 | 54 | 32.77-3.23 | 41.00-13.00 |
| 16 | Huddersfield | 28 | 58 | 37 | 32.13+4.13 | 36.84-0.16 |
| 18 | Swansea | 28 | 56 | 33 | 29.71+1.71 | 32.31-0.69 |
Did We Win/Lose Games That We Didn’t Deserve?
The expected points model suggests that the Swans should have finished bottom this season with 32.31 points, 4 points adrift of Stoke (36.17) and Huddersfield (36.84) above them.
While that would suggest that we were slightly fortunate to pick up the extra point, those results that we didn’t deserve, whether it was a win, lose or draw pretty much evened themselves out over the season.
The results below went against xG:
| Opposition | xG For | xG Against | Actual Score | Points Difference |
| Southampton (a) | 0.41 – | 2.22 | 0-0 | +1 |
| Crystal Palace (a) | 0.97 – | 0.82 | 0-2 | +2 |
| Newcastle (h) | 1.49 – | 1.03 | 0-1 | -1 |
| Spurs (a) | 0.15 – | 1.18 | 0-0 | +1 |
| Watford (h) | 1.51 – | 1.26 | 1-2 | -1 |
| Brighton (h) | 1.25 – | 0.87 | 0-1 | -1 |
| C Palace (h) | 0.55 – | 1.26 | 1-1 | +1 |
| Newcastle (a) | 0.9 – | 1.83 | 1-1 | +1 |
| Liverpool (h) | 0.5 – | 2.2 | 1-0 | +3 |
| Leicester (a) | 0.57 – | 1.48 | 1-1 | +1 |
| Huddersfield (a) | 0.0 – | 1.39 | 0-0 | +1 |
| Stoke (h) | 1.71 – | 1.75 | 1-2 | -1 |
The table outlines the main results that went against xG, and most of them were in our favour, as we gained more points that we shouldn’t have according to xG.
It’s interesting to see that Carvalhal was fortunate to gain an extra 5 points than expected, while Paul Clement was unfortunate in home defeats against Newcastle, Watford and Brighton.
The main under-performers according to xG were Crystal Palace, West Brom and Southampton. Palace’s expected points total was 58, an increase of 14 compared to their actual total of 44. Southampton too should have finished a lot higher, with an expected points total of 48.72 compared to their actual 36. Bottom side West Brom, meanwhile underperformed too, picking up 12 points less than expected and scoring 4 fewer goals.
Burnley were the big over-performers who were expected to finish with 13 points fewer than their 54, while AFC Bournemouth can be thankful of their 12th position, picking up 6 points more than expected.
Players – Abraham under-utilised?
The expected goals model by individual player suggests that Tammy Abraham was underrated and under-utilised this season.
The on-loan Chelsea striker achieved the highest expected goals per 90 minutes average score, with 0.32, compared to Jordan Ayew in second place with 0.22.
What this tells us is that if Abraham had played the same amount of minutes as Jordan Ayew, he would have been expected to score 10 goals, 4 more than he did. It’s worth pointing out that Abraham xG was 6.16, scoring one less than expected. That’s not surprising either, as Abraham has missed at least 1 or 2 great chances this season.
Andre Ayew, who has also been guilty of missing good quality chances had an expected goals value of 1.30. Defender Alfie Mawson was in third place in the xG ratings with 2.51, he scored 2 goals this season.
Abraham was only beaten by Wilfried Bony (2.45) in the shots per 90 minutes average with 2.22. A combination of expected goals and expected assists puts Tammy Abraham at the top of the charts with 0.4 – an average of 0.4 goals or assists every 90 minutes.
It’s worth remembering too that Abraham finished as our second highest goalscorer in the Premier League with 5 goals, only 2 less than Jordan Ayew despite playing over 1100 minutes less, equating to nearly thirteen 90-minute games.
The stats on this page are sourced from understat.com


